Google Analytics Tech Dashboard

How is your server doing? Don’t trust your IT department? Gain full insight into the performance of your hosting solution. Click the Install Dashboard button for a quick 1-click install


How is your server doing? Don’t trust your IT department?

Gain full insight into the performance of your hosting solution.

Install Dashboard

“Data is a precious thing and will last longer than the systems themselves.” – Tim Berners-Lee

Contents of this dashboard

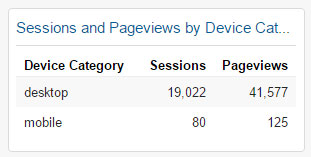
Widget 1 – Sessions and Pageviews by Device Category

Sessions and Pageviews by Device Category Widget
  • Sessions and Pageviews by Device Category
  • Device Category
  • Sessions
  • Pageviews
  • Links to: Audience / Mobile / Devices
  • Widget Type: Table
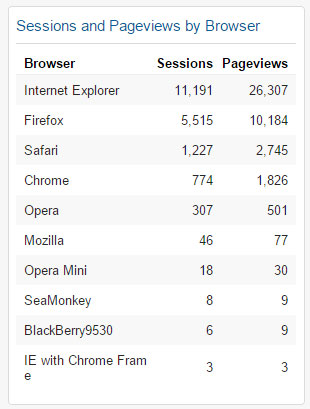
Widget 2 – Sessions and Pageviews by Browser

Sessions and Pageviews by Browser Widget
  • Sessions and Pageviews by Browser
  • Browser
  • Sessions
  • Pageviews
  • Links to: Audience / Technology / Browser & OS
  • Widget Type: Table
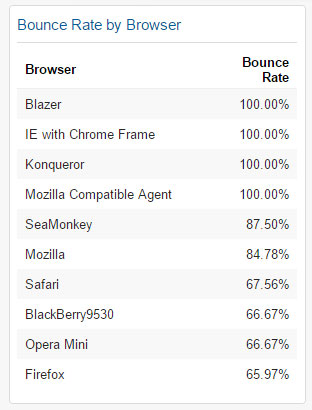
Widget 3 – Bounce Rate by Browser

Bounce Rate by Browser Widget
  • Bounce Rate by Browser
  • Browser
  • Bounce Rate
  • Filter: Don’t show Browser Containing Netfront
  • Filter: Don’t show Browser Containing WeSEE
  • Filter: Don’t show Browser Containing FlixsteriOS
  • Links to: Audience / Technology / Browser & OS
  • Widget Type: Table
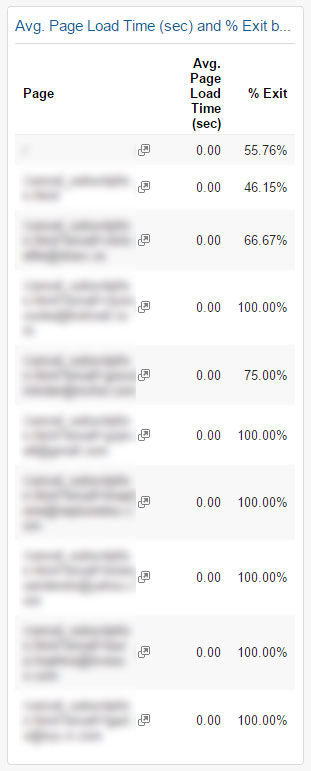
Widget 4 – Avg. Page Load Time (sec) and % Exit by Page

Avg. Page Load Time (sec) and % Exit by Page Widget
  • Avg. Page Load Time (sec) and % Exit by Page
  • Page
  • Average Page Load Time in Seconds
  • Exit Page Percentage
  • Links to: Behavior / Site Speed / Page Timings
  • Widget Type: Table
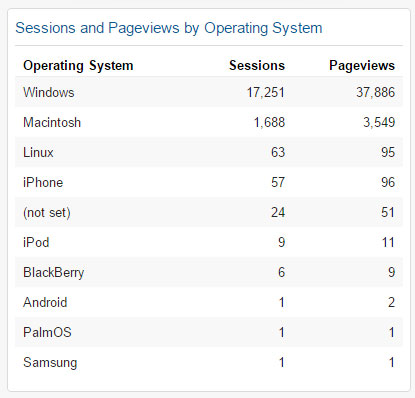
Widget 5 – Sessions and Pageviews by Operating System

Sessions and Pageviews by Operating System Widget
  • Sessions and Pageviews by Operating System
  • Operating System
  • Sessions
  • Pageviews
  • Links to: Audience / Technology / Browser & OS
  • Widget Type: Table
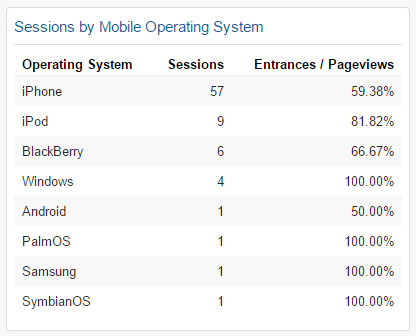
Widget 6 – Sessions by Mobile Operating System

Sessions by Mobile Operating System Widget
  • Sessions by Mobile Operating System
  • Operating System
  • Sessions
  • Entrances and Pageviews
  • Filter: Device Category Exactly matching mobile
  • Links to: Audience / Technology / Browser & OS
  • Widget Type: Table
Widget 7 – Sessions and Pageviews by Mobile Device Branding

Sessions and Pageviews by Mobile Device Branding Widget
  • Sessions and Pageviews by Mobile Device Branding
  • Mobile Device Branding
  • Sessions
  • Pageviews
  • Links to: Audience / Technology / Browser & OS
  • Widget Type: Table
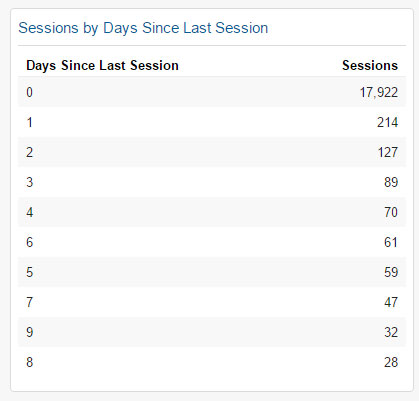
Widget 8 – Sessions by Days Since Last Session

Sessions by Days Since Last Session Widget
  • Sessions by Days Since Last Session
  • Days Since Last Session
  • Sessions
  • Links to: Audience / Behavior / Frequency & Recency
  • Widget Type: Table
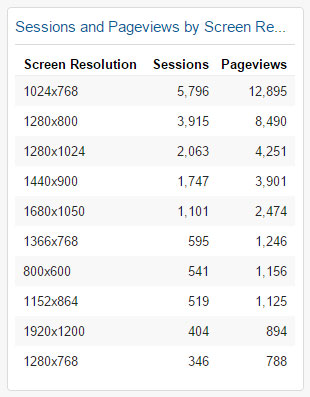
Widget 9 – Sessions and Pageviews by Screen Resolution

Sessions and Pageviews by Screen Resolution Widget
  • Sessions and Pageviews by Screen Resolution
  • Screen Resolution
  • Sessions
  • Pageviews
  • Links to: Audience / Technology / Browser & OS
  • Widget Type: Table
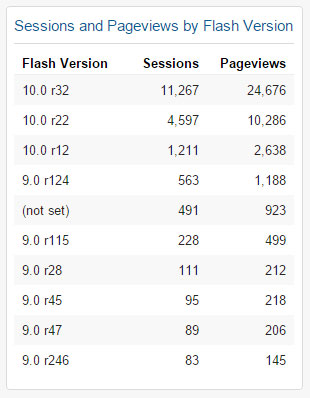
Widget 10 – Sessions and Pageviews by Flash Version

Sessions and Pageviews by Flash Version Widget
  • Sessions and Pageviews by Flash Version
  • Flash Version
  • Sessions
  • Pageviews
  • Links to: Audience / Technology / Browser & OS
  • Widget Type: Table
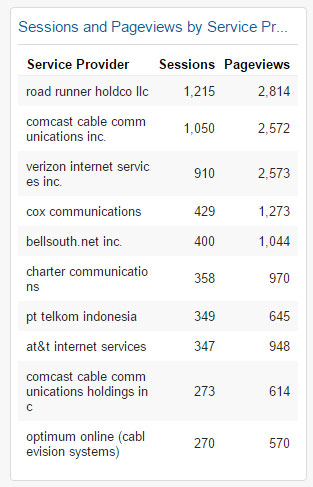
Widget 11 – Sessions and Pageviews by Service Provider

Sessions and Pageviews by Service Provider Widget
  • Sessions and Pageviews by Service Provider
  • Service Provider
  • Sessions
  • Pageviews
  • Links to: Audience / Technology / Browser & OS
  • Widget Type: Table
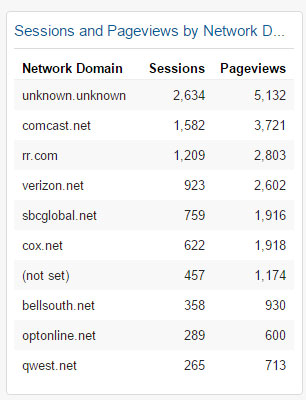
Widget 12 – Sessions and Pageviews by Network Domain

Sessions and Pageviews by Network Domain Widget
  • Sessions and Pageviews by Network Domain
  • Network Domain
  • Sessions
  • Pageviews
  • Links to: Audience / Technology / Network
  • Widget Type: Table

Who would use this dashboard

How is your server doing? Don’t trust your IT department?

Gain full insight into the performance of your hosting solution.

Install Dashboard