Google Analytics Location Source Dashboard

How do critical metrics change from location to location? This hybrid map, chart and list dashboard visualizes performance across locations with data. Click the Install Dashboard button for a quick 1-click install


How do critical metrics change from location to location?

This hybrid map, chart and list dashboard visualizes performance across locations with data.

Install Dashboard

Why I created this dashboard

How I use this dashboard

“Facts do not cease to exist because they are ignored.” – Aldous Huxley

Contents of this dashboard

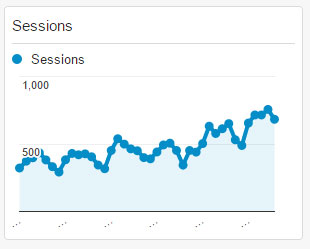
Widget 1 – Sessions (Graph)

Sessions Widget
  • Sessions
  • Sessions
  • Links to:
  • Widget Type: Timeline
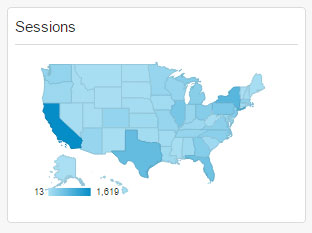
Widget 2 – Sessions (Map)

Sessions Widget
  • Sessions
  • Region
  • Sessions
  • Links to:
  • Widget Type: Map
Widget 3 – Sessions and Total Events by Region

Sessions and Total Events by Region Widget
  • Sessions and Total Events by Region
  • Region
  • Sessions
  • Total Events
  • Filter: Don’t show Event Category Exactly matching Time
  • Links to:
  • Widget Type: Table
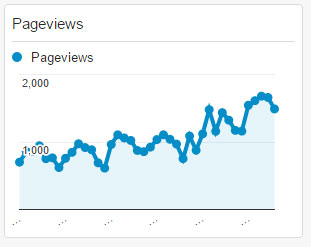
Widget 4 – Pageviews (Graph)

Pageviews Widget
  • Pageviews
  • Pageviews
  • Links to:
  • Widget Type: Timeline
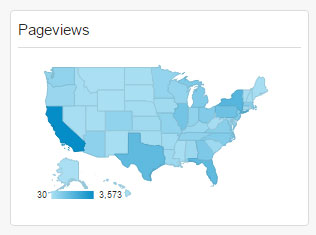
Widget 5 – Pageviews (Map)

Pageviews Widget
  • Pageviews
  • Region
  • Pageviews
  • Filter: Medium Exactly matching organic
  • Links to:
  • Widget Type: Map
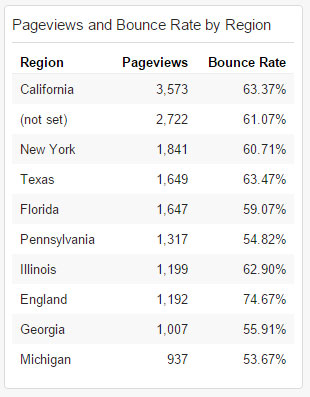
Widget 6 – Pageviews and Bounce Rate by Region

Pageviews and Bounce Rate by Region Widget
  • Pageviews and Bounce Rate by Region
  • Region
  • Pageviews
  • Bounce Rate
  • Links to:
  • Widget Type: Table
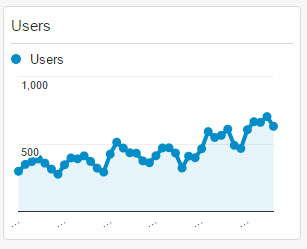
Widget 7 – Users (Graph)

Users Widget
  • Users
  • Users
  • Links to:
  • Widget Type: Timeline
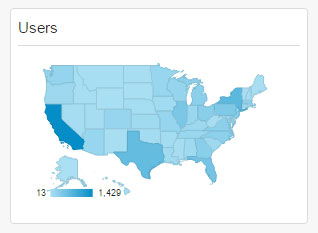
Widget 8 – Users (Map)

Users Widget
  • Users
  • Region
  • Users
  • Filter: Medium Exactly matching organic
  • Links to:
  • Widget Type: Map
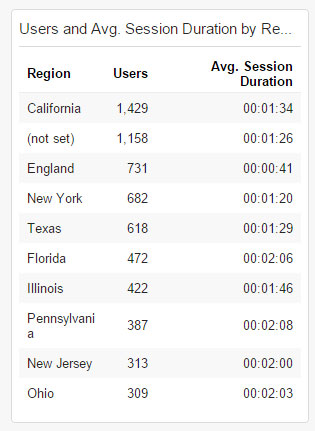
Widget 9 – Users and Avg. Session Duration by Region

Users and Avg. Session Duration by Region Widget
  • Users and Avg. Session Duration by Region
  • Region
  • Users
  • Average Session Duration
  • Links to:
  • Widget Type: Table
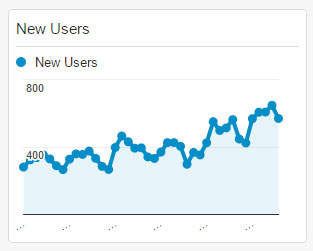
Widget 10 – New Users (Graph)

New Users Widget
  • New Users
  • New Users
  • Links to:
  • Widget Type: Timeline
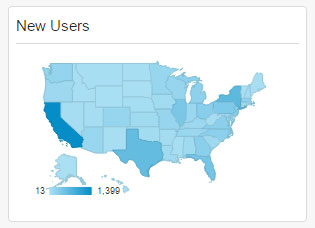
Widget 11 – New Users (Map)

New Users Widget
  • New Users
  • Region
  • New Users
  • Filter: Medium Exactly matching organic
  • Links to:
  • Widget Type: Map
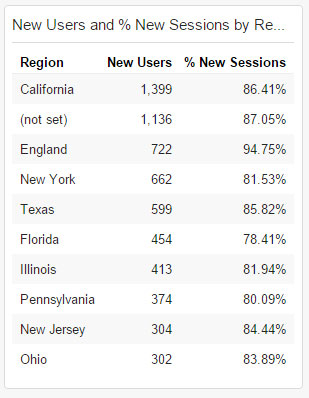
Widget 12 – New Users and % New Sessions by Region

New Users and % New Sessions by Region Widget
  • New Users and % New Sessions by Region
  • Region
  • New Users
  • Percentage of New Sessions
  • Links to:
  • Widget Type: Table

Who would use this dashboard

How do critical metrics change from location to location?

This hybrid map, chart and list dashboard visualizes performance across locations with data.

Install Dashboard